Copilot for
Data Visualization
Raw data to professional plots in minutes
AI prompts for high-level ideas
dynamic UI to fine-tune every detail
|
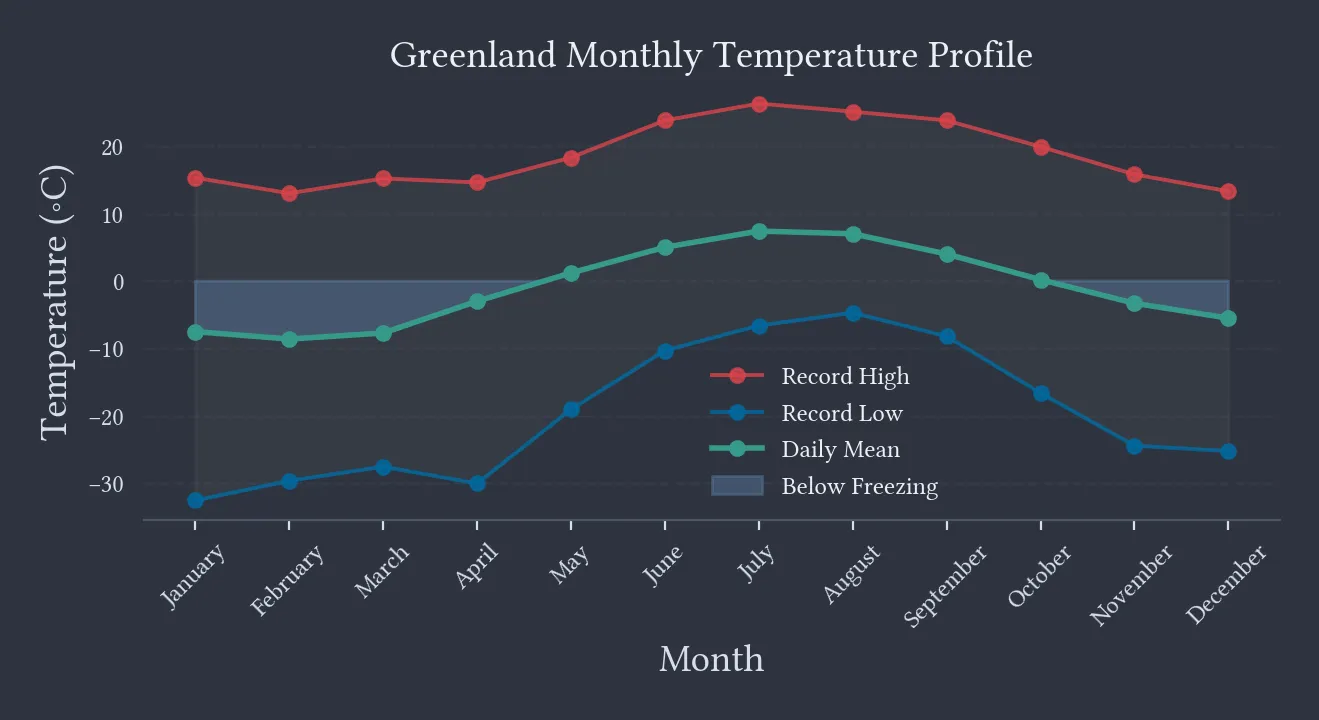
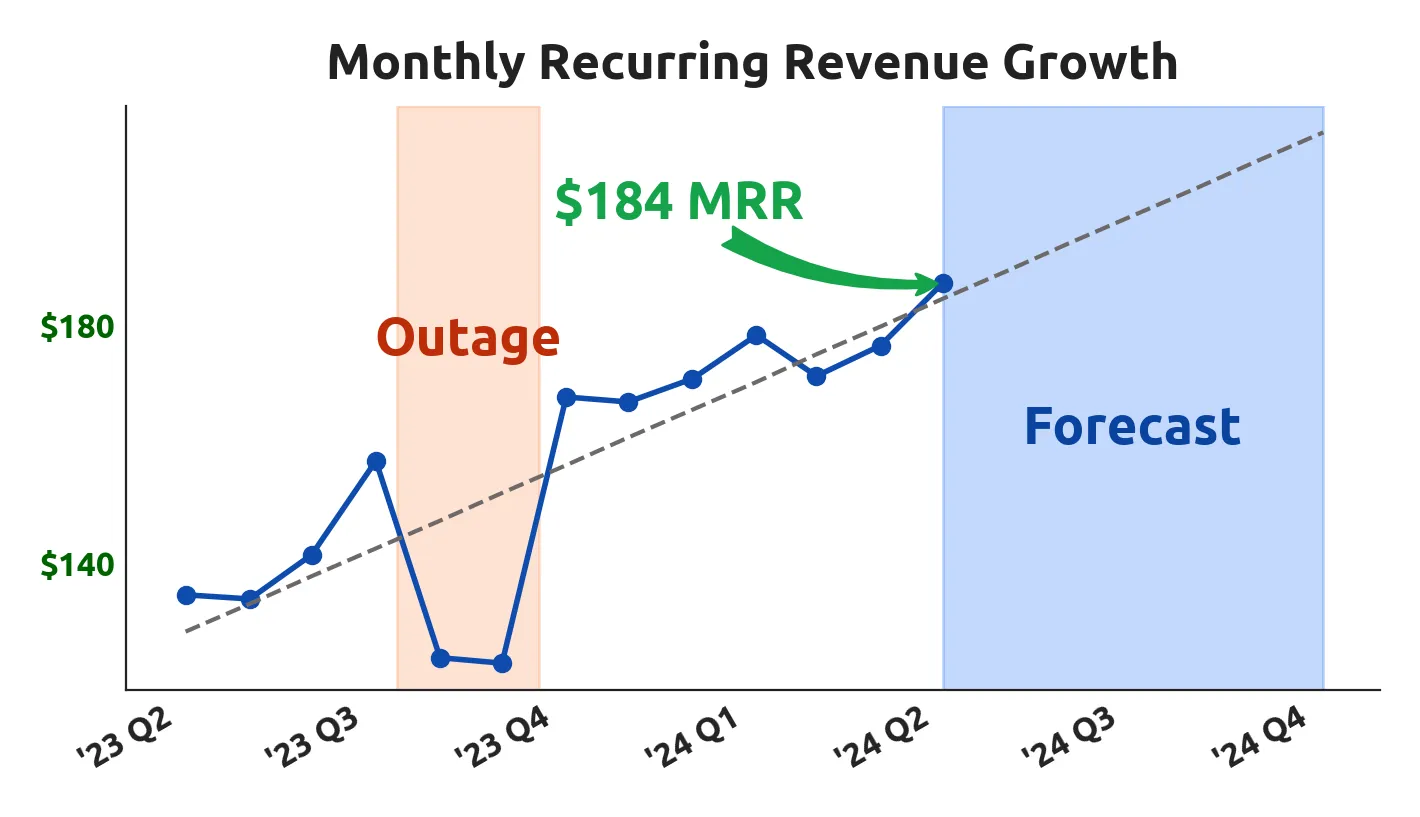
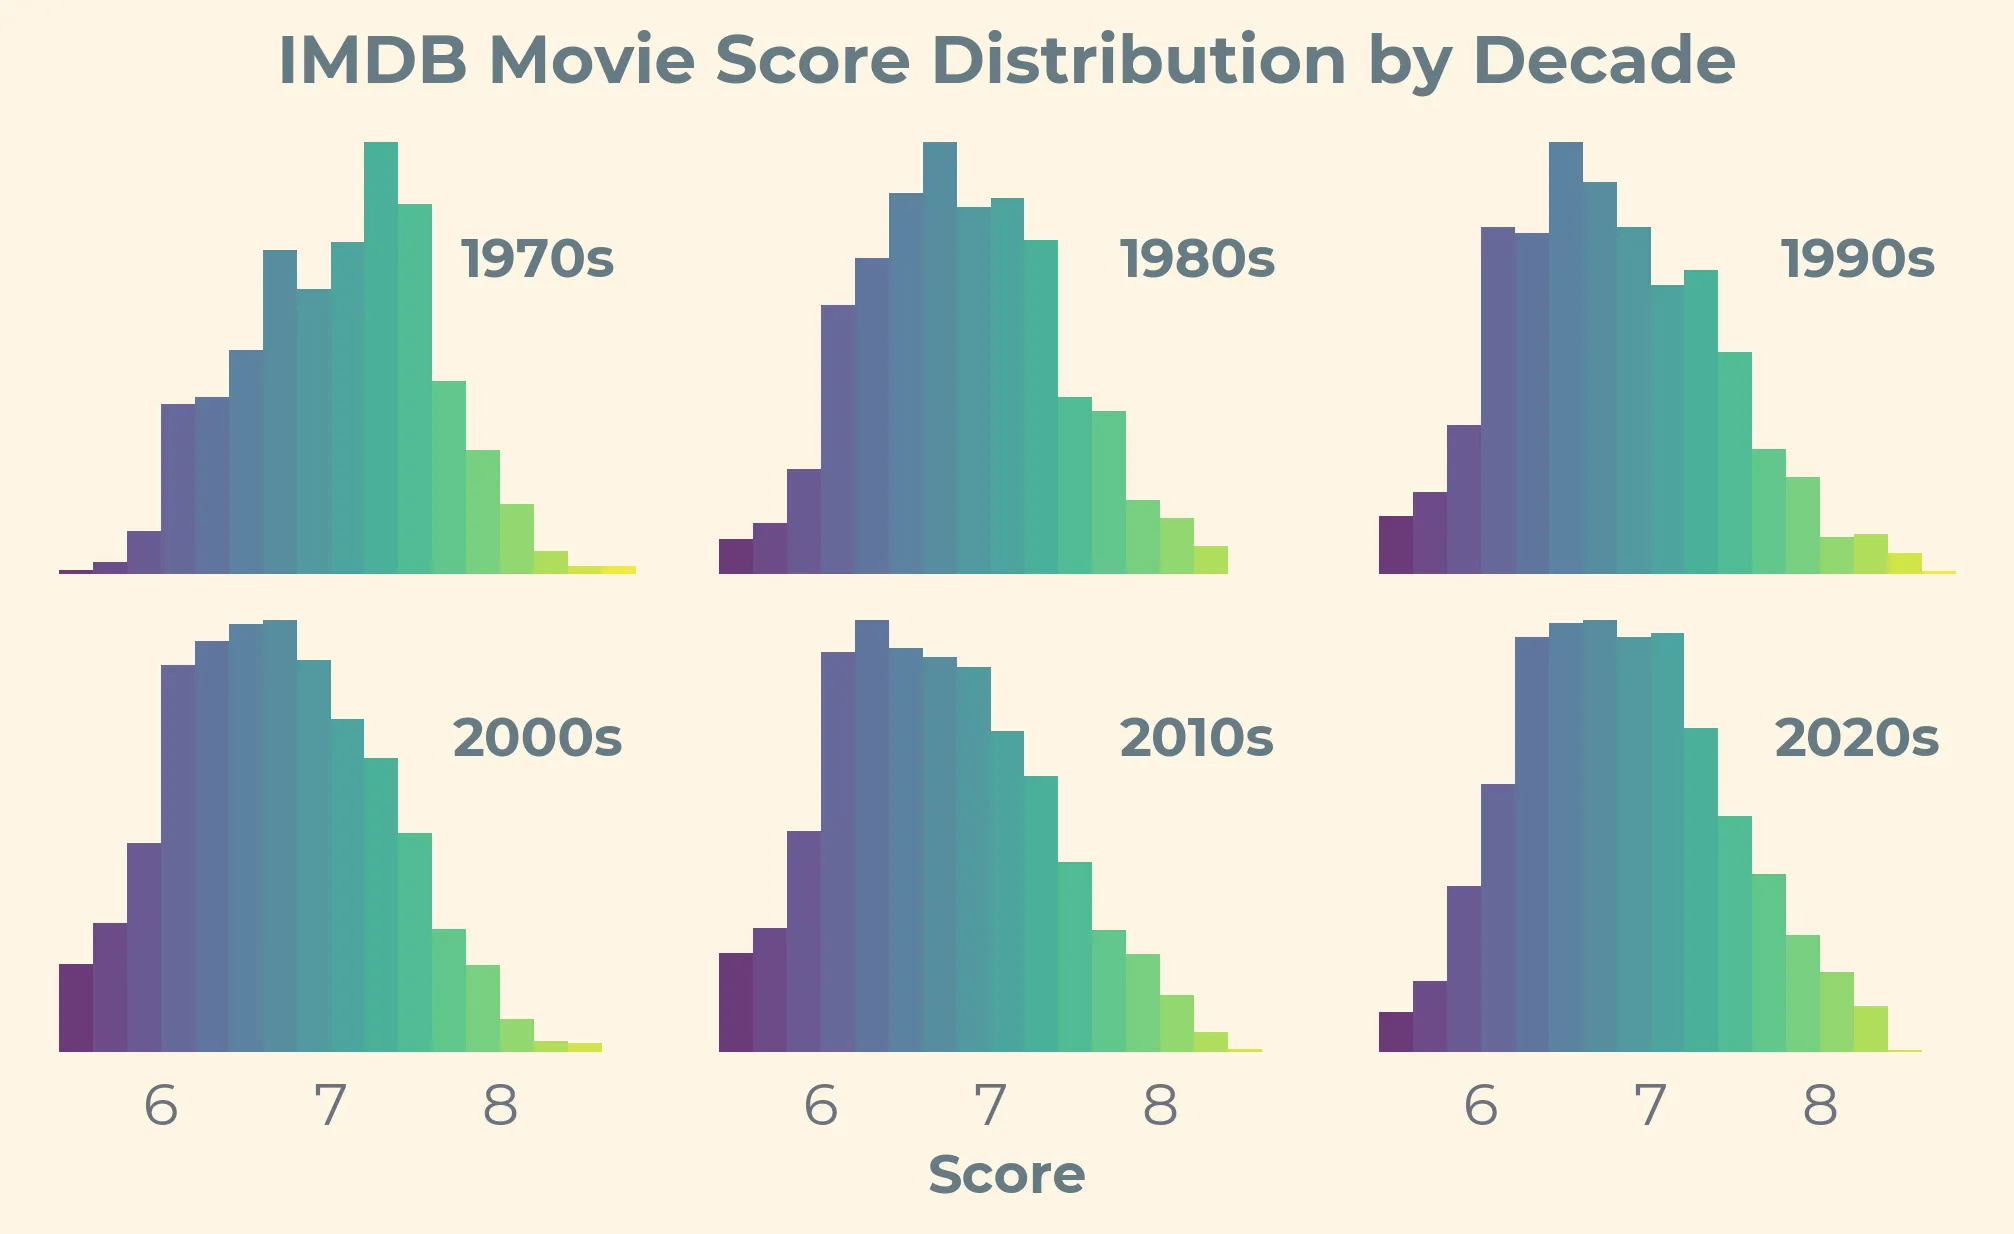
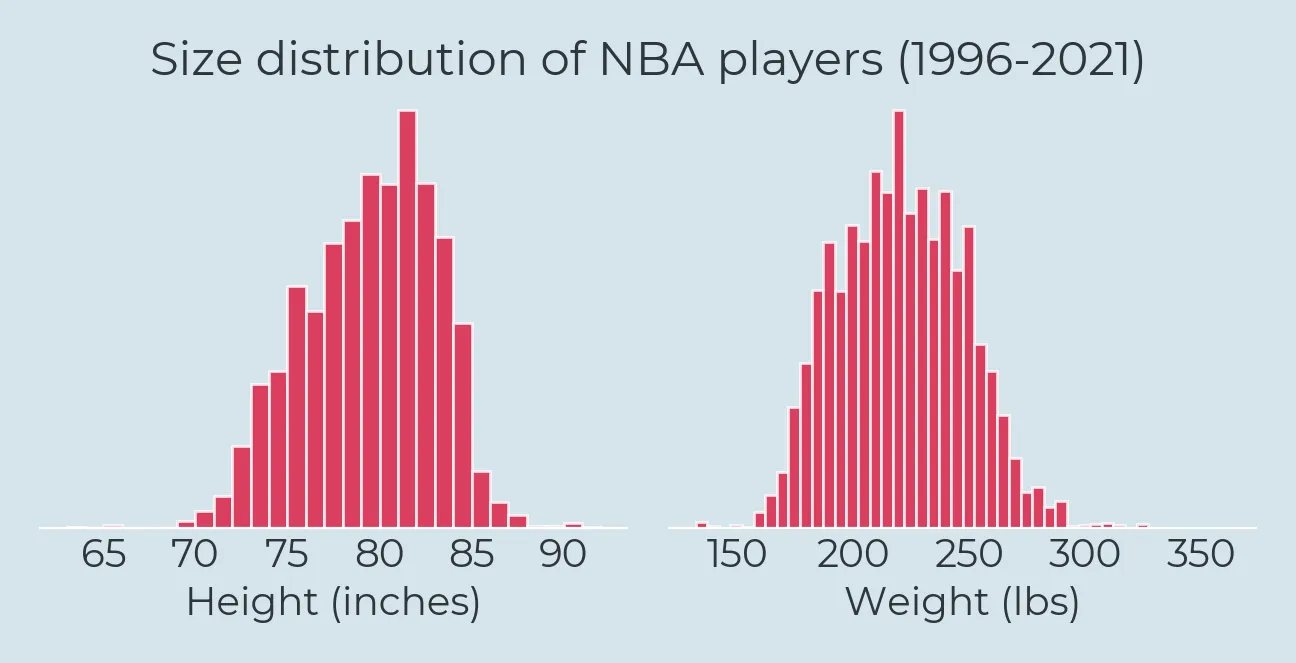
Upgrade your plots
Stop struggling with complex plotting software. Achieve effective results by iterating quickly with a copilot that understands your intentions.
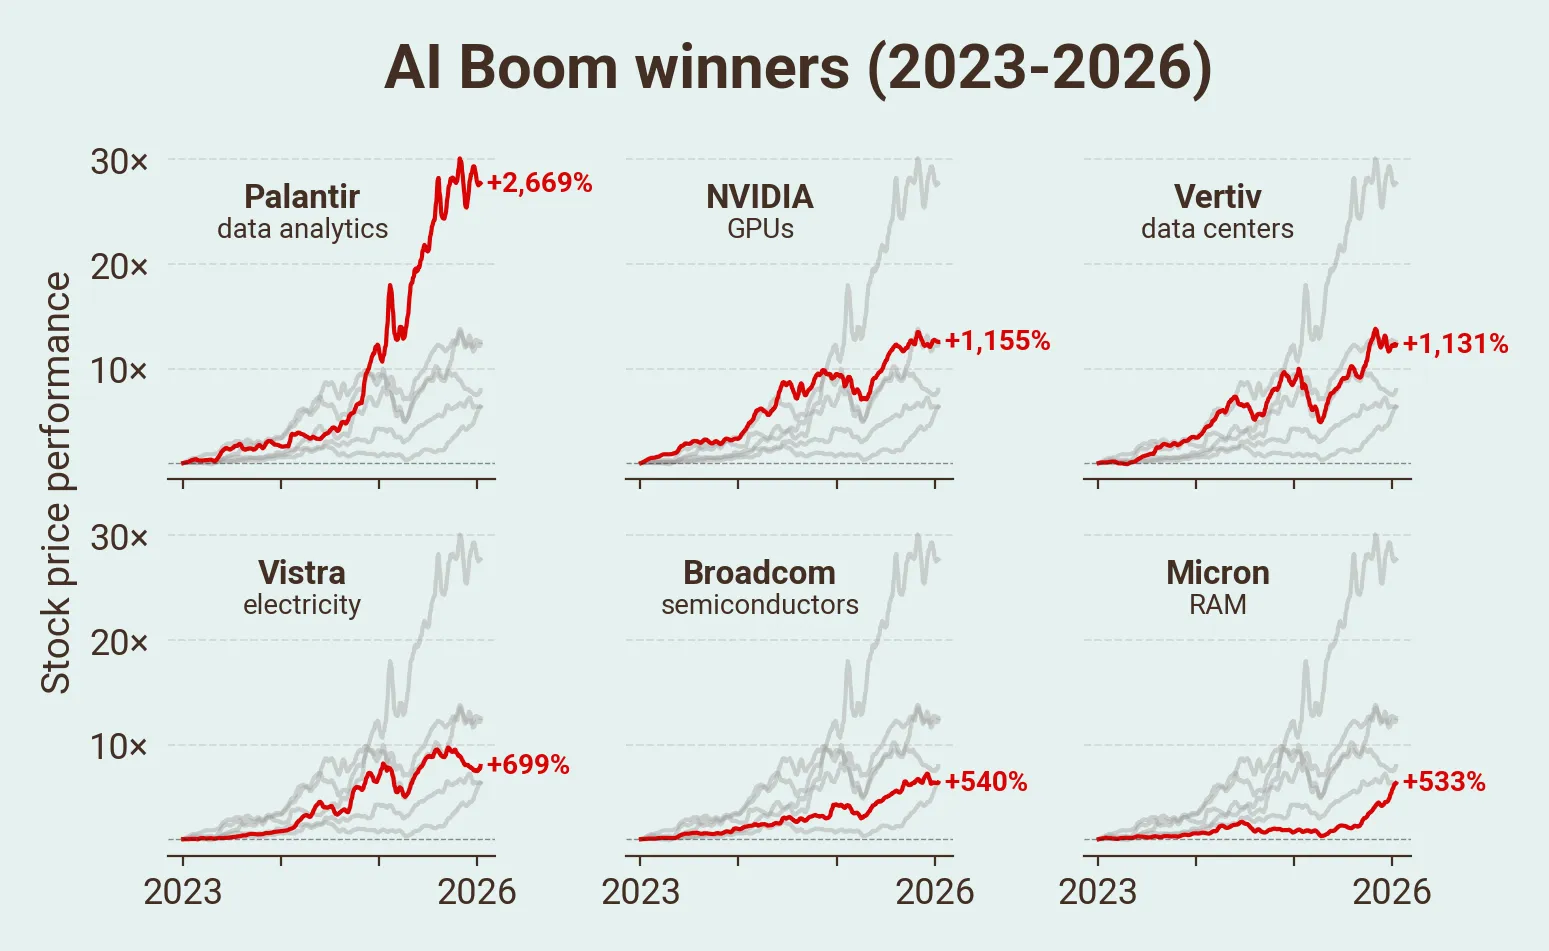
BEFORE
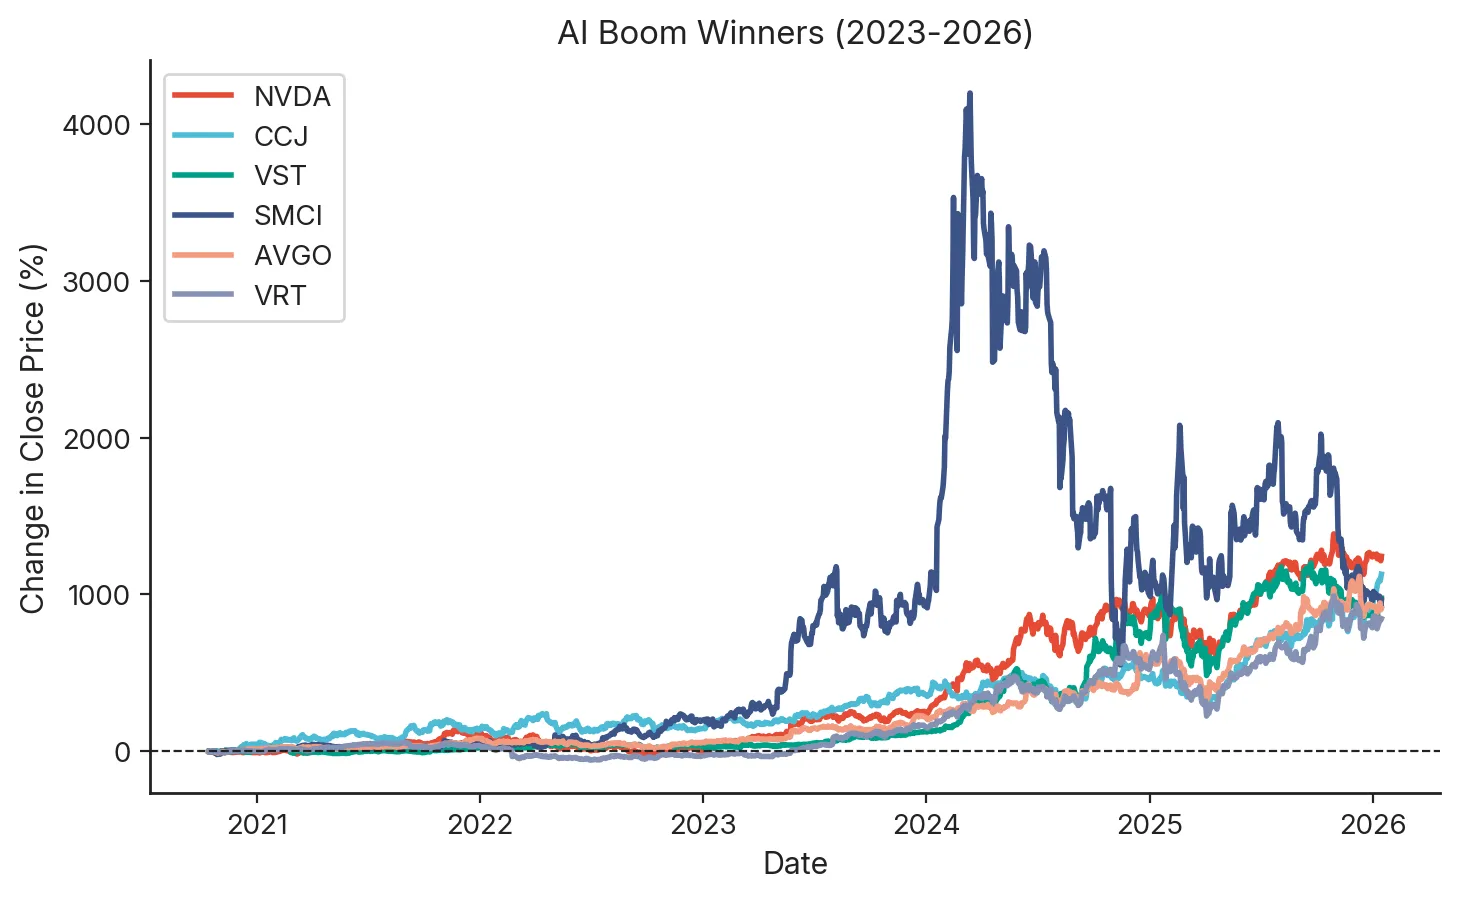
↓
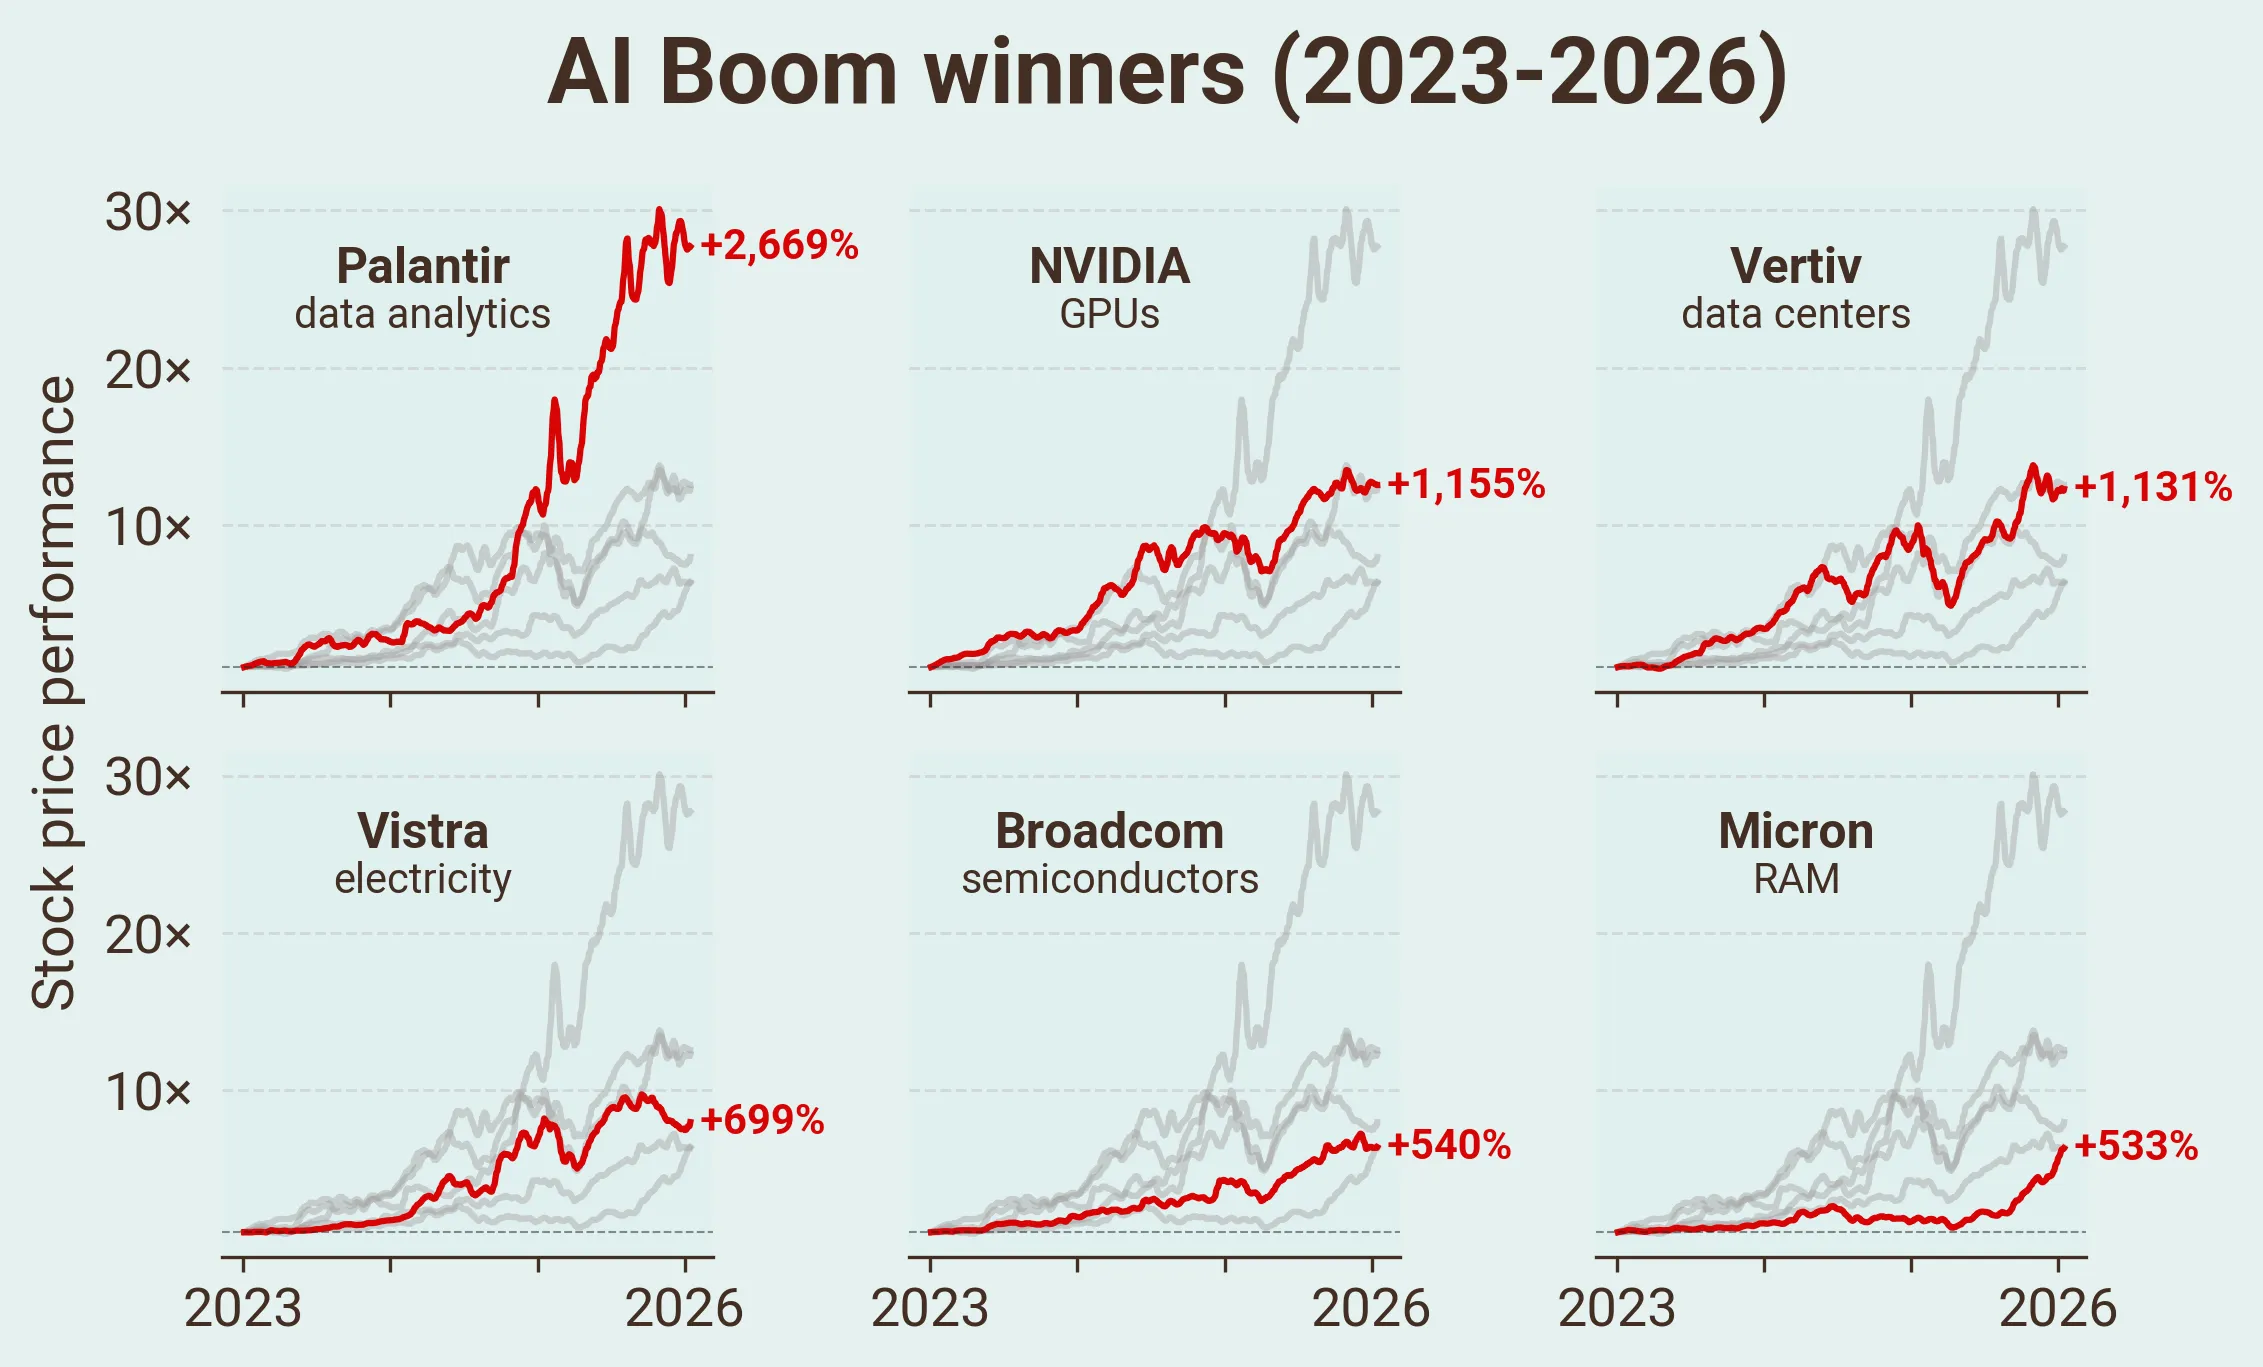
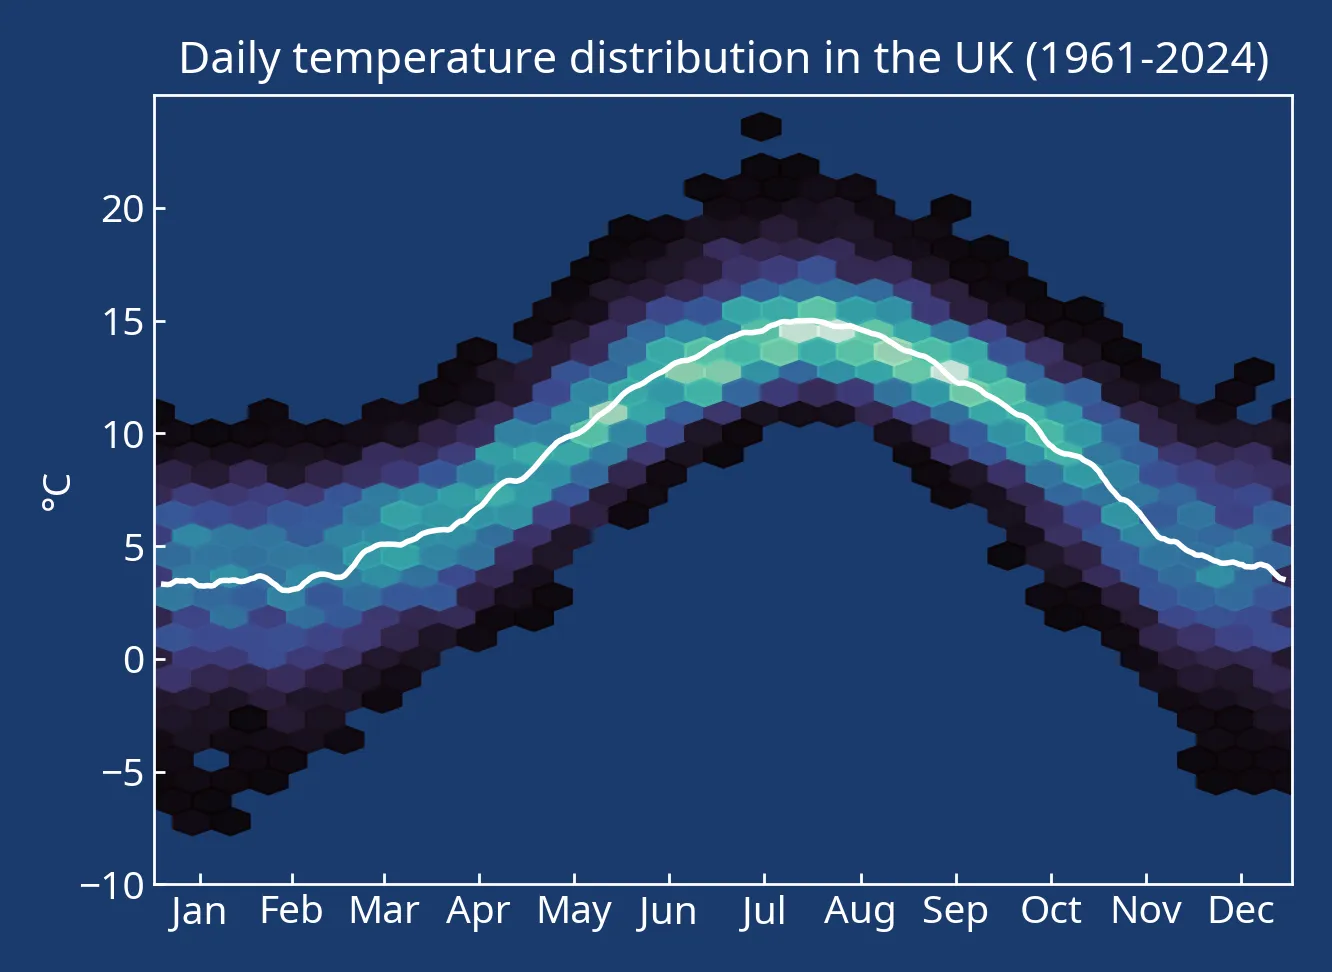
AFTER
Explore the gallery
Crafted with Skyplots

Pricing
Starter
$9/mo
- Up to 10 projects
- 400 Monthly AI Credits
- Standard AI assistance
- High-res raster exports (png, webp)
Most Popular
Standard
$19/mo
- Up to 50 projects
- 1000 Monthly AI Credits
- Standard AI assistance
- High-res raster exports (png, webp)
- Vector-graphics exports (svg, pdf)
Professional
$39/mo
- Up to 500 projects
- 2000 Monthly AI Credits
- Smarter AI assistance
- High-res raster exports (png, webp)
- Vector-graphics exports (svg, pdf)
Starter
$7/mo
billed annually ($84)
Save 22%- Up to 10 projects
- 400 Monthly AI Credits
- Standard AI assistance
- High-res raster exports (png, webp)
Most Popular
Standard
$15/mo
billed annually ($180)
Save 21%- Up to 50 projects
- 1000 Monthly AI Credits
- Standard AI assistance
- High-res raster exports (png, webp)
- Vector-graphics exports (svg, pdf)
Professional
$30/mo
billed annually ($360)
Save 23%- Up to 500 projects
- 2000 Monthly AI Credits
- Smarter AI assistance
- High-res raster exports (png, webp)
- Vector-graphics exports (svg, pdf)